Firmware - like most software - tends to require testing to shake out all the bugs. While a typical software developer might reach for a container, a fuzzer, debugger, and/or their favorite mocking framework to begin testing an application, testing firmware tends to require more finesse.
The Debugger
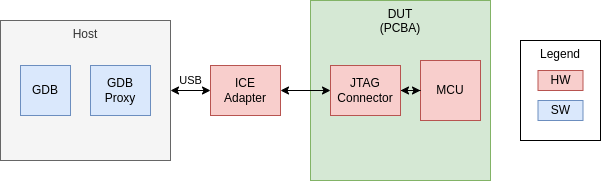
High quality tools like debuggers exist for firmware development. An embedded microcontroller (MCU) will typically have a JTAG or Serial Wire Debug (SWD) interface for loading code, poking registers, and setting breakpoints. To access the debug interface, the developer needs an in-circuit emulator (ICE), often called a “JTAG adapter”, “programmer cable”, “debugger”, etc. The ICE is a hardware device that provides a standard interface like USB, ethernet, etc to the host on one end and a JTAG interface to the MCU on the other. The host is the developer’s computer where they can write code from the comfort of their favorite IDE or editor.
Hardware
The ICE connects to the Device Under Test (DUT) via a hardware connector. Many MCUs will have a standardized connector like the 10-pin Cortex Debug:
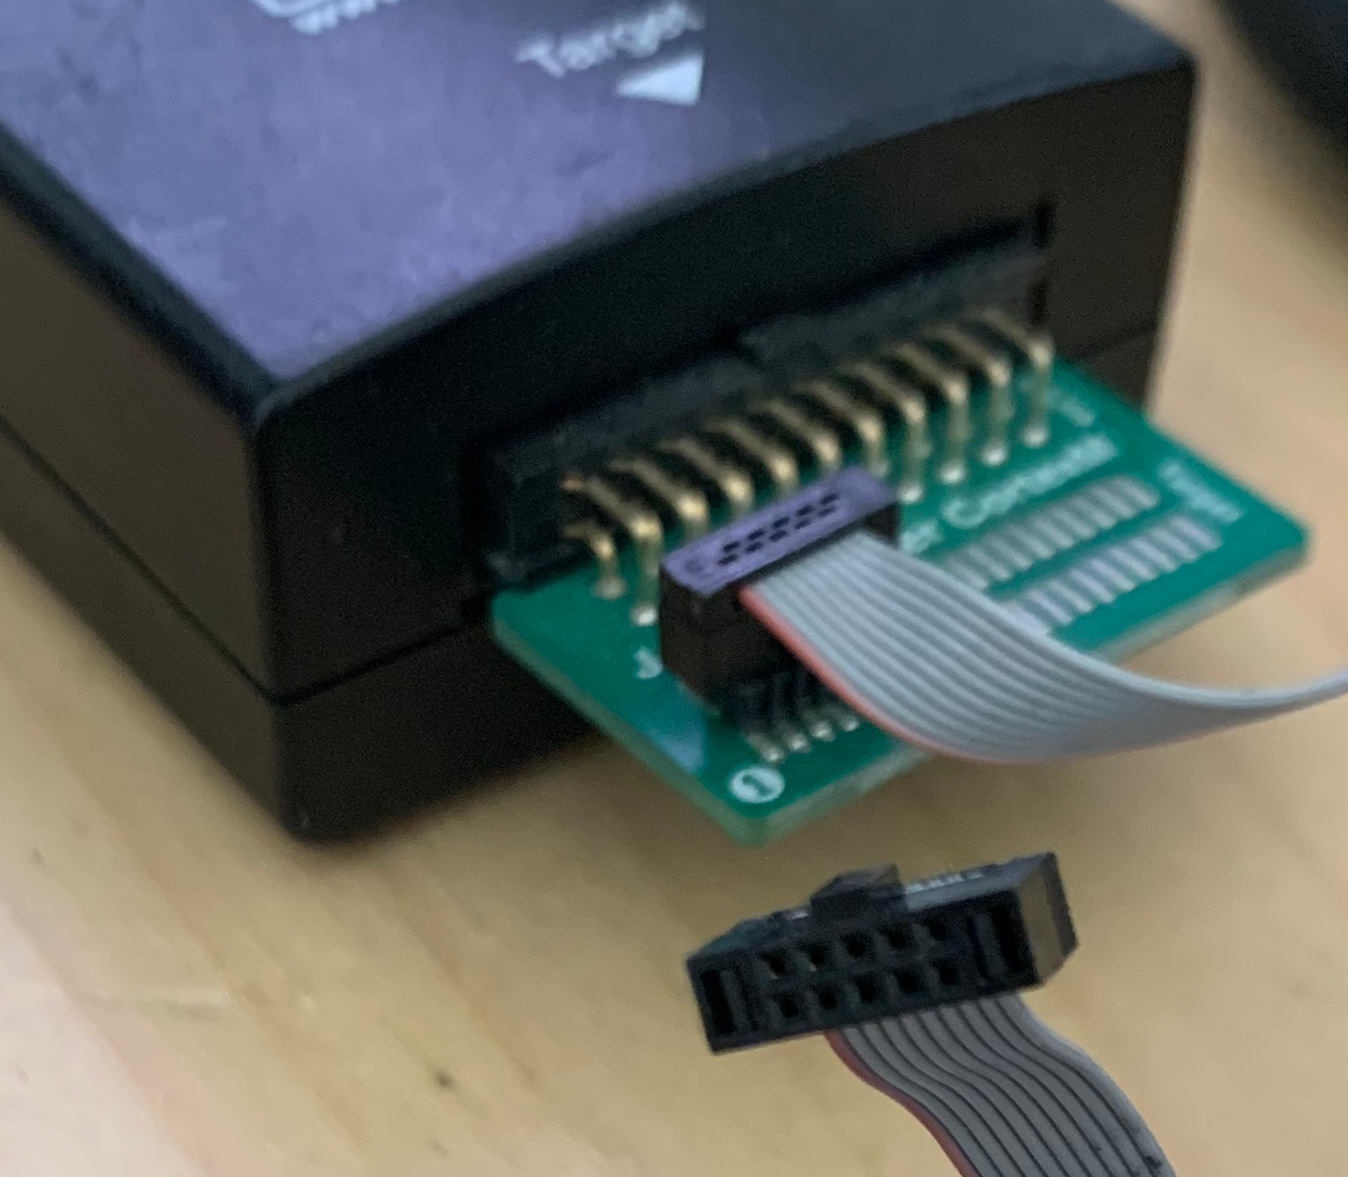
Others use less standard but readily available 0.1" pitch header formats:
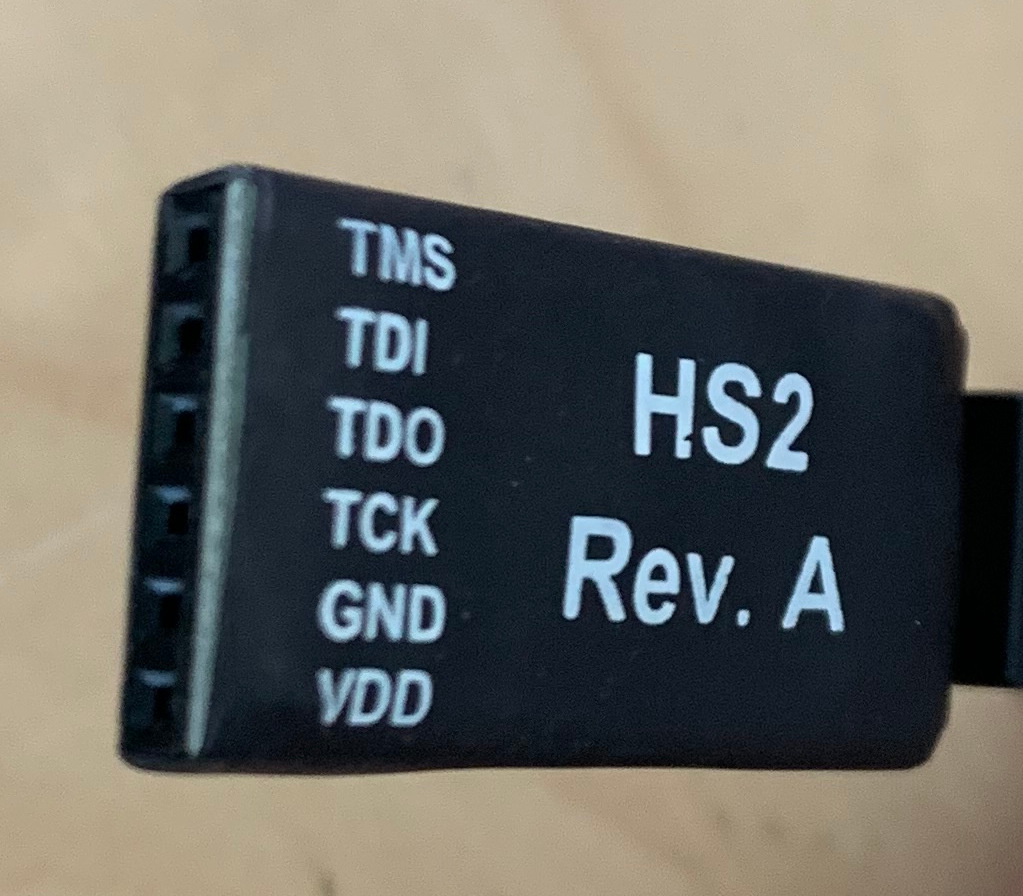
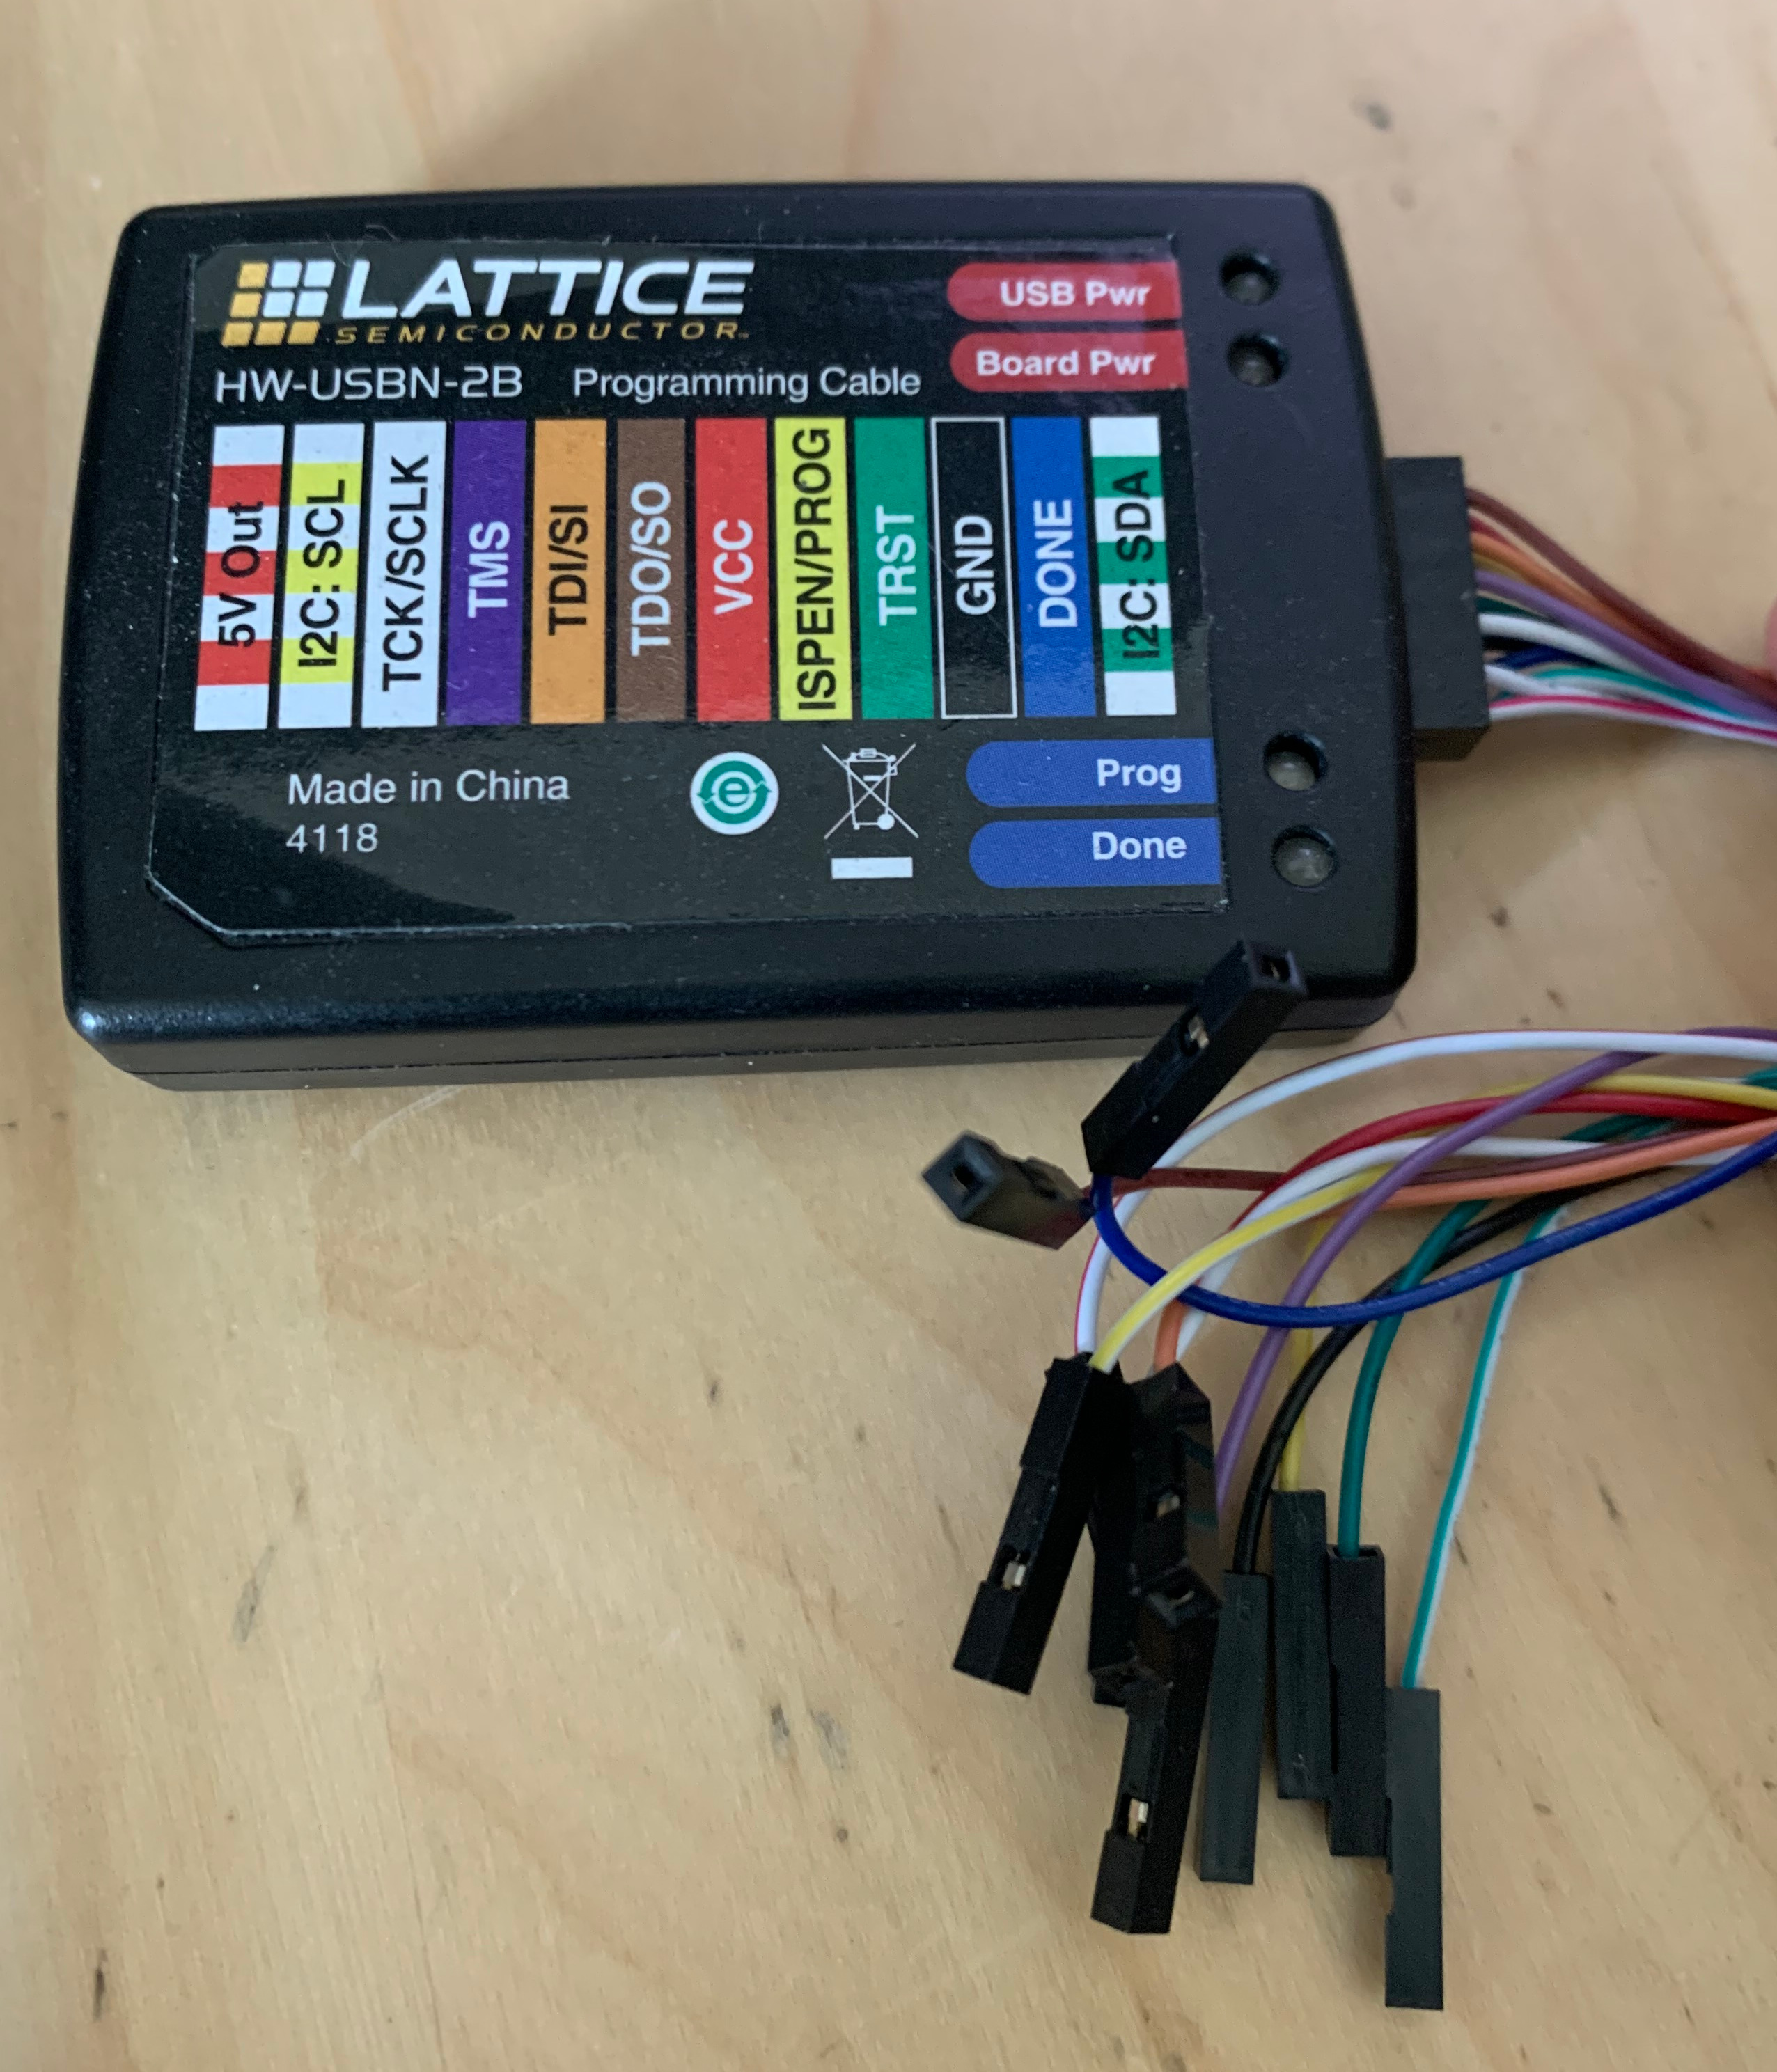
Still others provide you with the flexibility to do whatever you need to do:
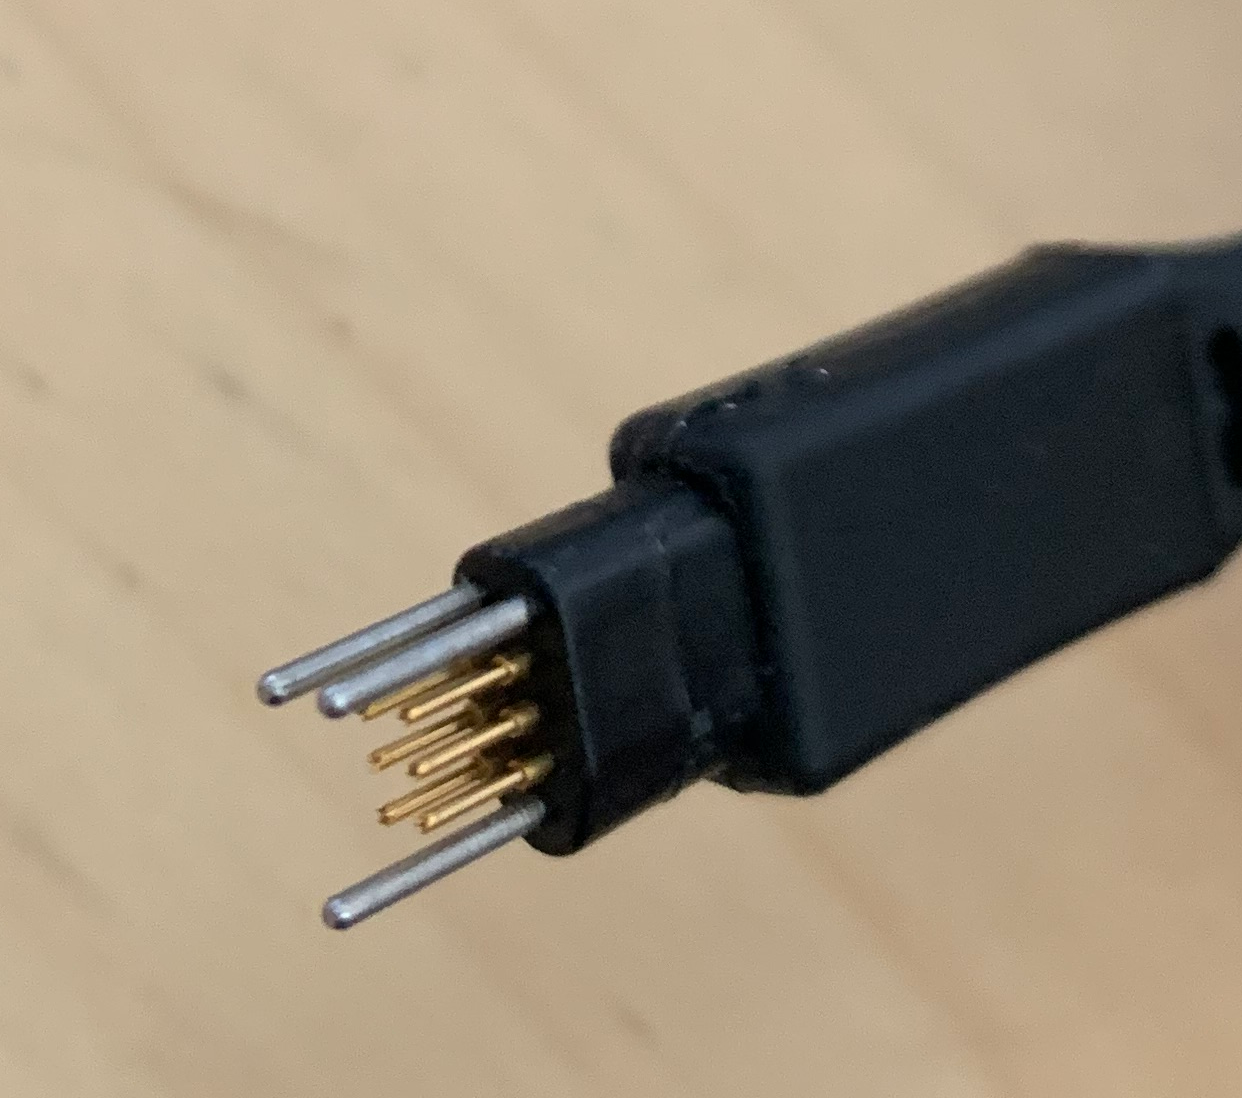
There are even “Connector-less” variants - such as the Tag-Connect family of adapters.
Over the course of a career in embedded systems, you accumulate a samples of many different species of adapters. See the Debugger Menagerie.
Working with different voltages
Not every design is going to use the same voltage for the MCU’s core or IO pins. Though there are standard voltage levels like 3.3V and 1.8V, most devices are specified with a operating range from say 1.8-3.6V. The designer could choose to operate the system at 3.0V if that was optimal for their constraints.
To provide flexibility, the ICE connector will often have a “Target Voltage” pin. This pin allows the DUT to provide a stable supply voltage that will act as the reference for the JTAG or SWD IO signals. Typically, the ICE then has some means of level conversion to generating signals that are optimal for the DUT.
Software
Typically, the host computer needs to run a “Proxy” to connect to the physical ICE. For GDB, this typically comes in the form of a “GDB Proxy Server.”
Examples:
The proxy provides a consistent software interface to the debugger GDB. The user will typically need to create a .gdbinit file to
instruct GDB that there is a remote target.
The .gdbinit file is “executable” so often you need to instruct gdb that it is safe to load your particular .gdbinit file.
What about Trace
Some MCUs will have a “Trace” functionality. The trace output generates an encoded sequence data that explains what instructions the MCU executed near a particular point. Typically, the trace unit will be trigger by a breakpoint and then some max number of instructions will be dumped out of the trace port.
Typically this is reserved for larger packages where the extra pins needed to support trace are readily available. SWD does have the option for a SWO signal on some microcontrollers that can provide a single wire trace output.
The trace functionality is useful for debugging issues in parts of firmware code where a breakpoint might cause physical damage to the system. Consider a motor control application where the PWM outputs are used to control current through the windings of the phases. A breakpoint might cause the currents to stop or continue in a fashion that might damage the drive.
Similarly, there are times when a breakpoint in a driver might cause the state between the MCU and a peripheral to become desynchronized. For example - consider an USB peripheral where certain packets must be delivered according to a specific timing schedule. If the host stops sending due to a breakpoint - then the state of host and device will likely drift. This may cause the device to reset while the host thinks it is still enumerated.
Limitations
The debugger and ICE for a microcontroller will often times have some limitations. The MCU will have a Test Access Port (TAP) implemented in silicon that provides the JTAG interface. The TAP controller provides access to the boundary scan registers as well as to the debug interface of the chip.
The debug interface of the chip is often limited; it may only support 2 or 3 hardware breakpoints. It may not support data/watch breakpoints at all. Sometimes the ICE will step and provide more functionality like for instances in the J-Link series of adapters with their Flash breakpoints.
Because JTAG is a serial protocol, the clock speed of the TCK signal can limit the total throughput. SWD’s half-duplex nature makes this even worse for small microcontrollers. The frequency of the bus can only be increased so far before we breach setup and hold times.